
Project Reports for Teams
Reports turn the time your team recorded into an answer about where the work went. The Reports tab offers three views of the same data — a general report across projects and people, a report on people that splits each employee’s time by project and day, and a concise report that gives daily totals per person without the breakdown. All three include time captured by the timer and time added manually, so work done away from the keyboard counts the same as work done in front of it. Every report can be filtered by project, by period, by employee and by task readiness, which is what turns a general question into a specific one: this client, last month, this person, finished work only. Because tracking happens against tasks, every hour in a report can be traced back to the piece of work it came from. This page covers each report type, who reads which one, and how reports relate to tracking itself.
What the reports answer Link copied!
Three different people ask three different questions of the same hours, and the three report types exist because one table cannot answer all of them well.
A project lead asks where did this project’s time go — across which people, across which days. A manager asks what did this person spend the month on — which projects, in what proportion. An administrator preparing an invoice or a payroll line asks how many hours per person per day, with no breakdown at all, because the breakdown is noise for that purpose.
Two properties decide whether any of these answers can be trusted. The first is that reports include manually added time as well as timer-recorded time. A report that only counted the timer would systematically undercount meetings, calls and offline work, and a systematically wrong number is worse than no number, because people act on it. The second is that hours are attached to tasks, so any figure can be traced back to the specific work behind it. That is the difference between a report you can present and a report you have to defend.
The filters are the third property, and in practice the one used most. The default view is the whole company over a period; the useful view is almost always narrower.
General report Link copied!
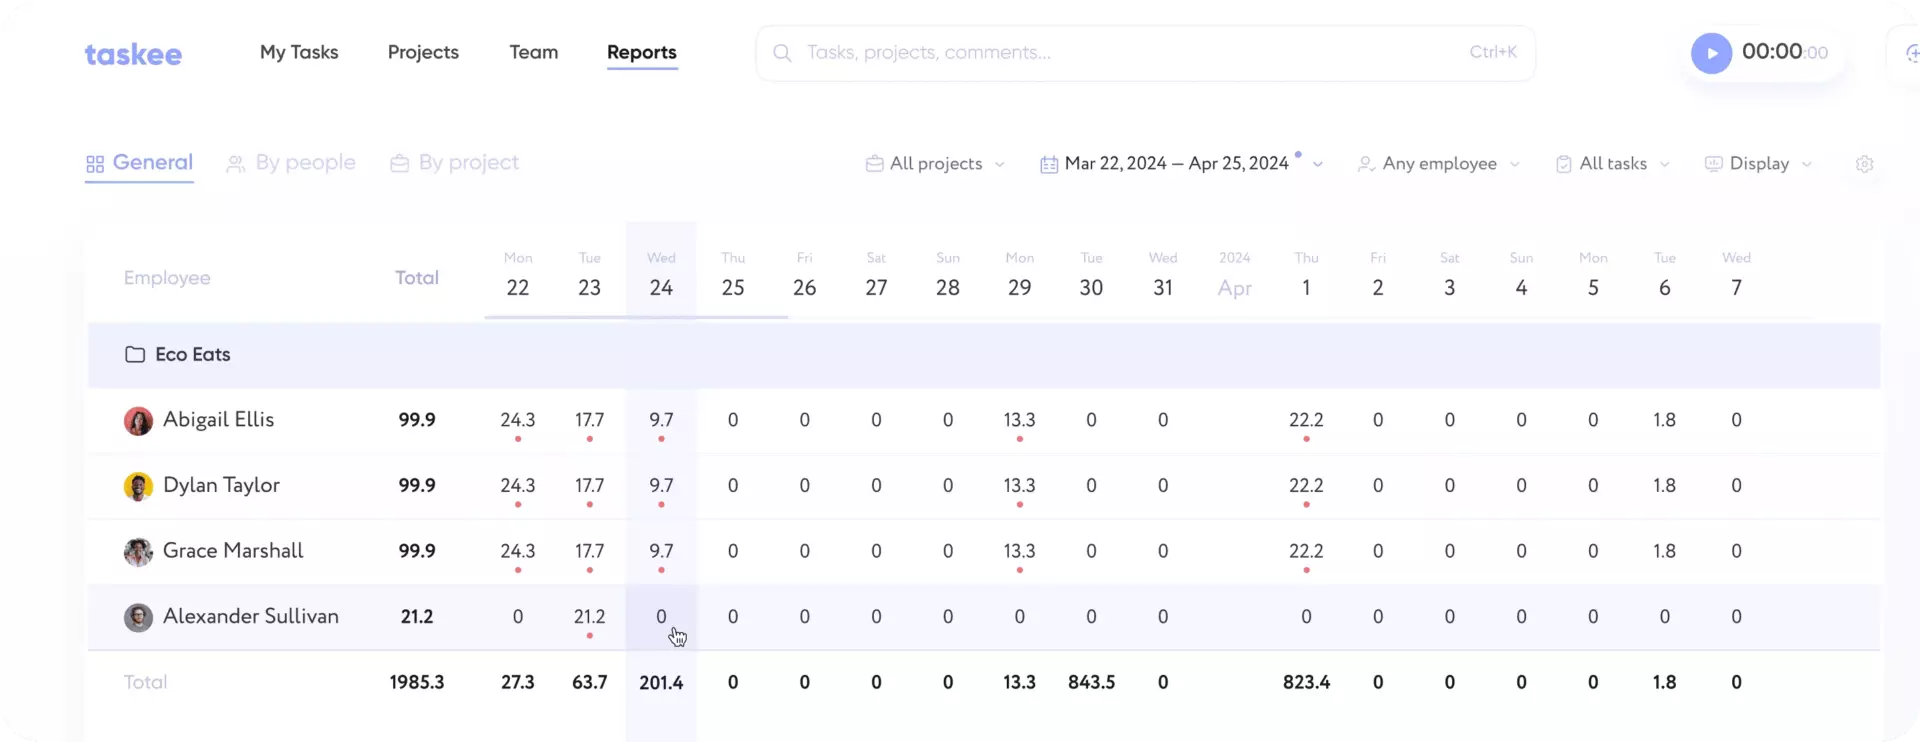
The Reports tab offers three types of reports for analyzing the time when the team was working. The report included both time automatically recorded via tracker and time added manually to the tasks. You can filter reports by project, period, employee and task readiness status. General report displays the complete list of projects, participants and overall number of hours worked per day.
This is the report to start from, because it shows the shape of the whole picture before you narrow it. Filtered to one project and one month, it becomes the project retrospective: which people were involved, how the effort was distributed across days, and where the heavy weeks were.
The readiness filter is the one people underuse. Restricting a report to finished work answers a different question from total effort — it separates hours that produced a completed result from hours still in flight, which is the comparison that matters when you are deciding whether a project is on track or merely busy.
Report on people Link copied!
Report on people has the time each employee worked for, divided into projects and days.
This is the allocation view. It answers what one person’s month actually consisted of, and it usually surprises people: work that was supposed to be a small favour to another project turns out to have absorbed a fifth of the month, and the project everyone believed was the priority received less than anyone assumed.
That makes it the most useful input to planning that a team has. Capacity arguments conducted from memory go in circles; the same conversation with a per-person, per-project split takes ten minutes. It is worth being explicit about how the view should be used — as a picture of where effort landed, so the next allocation can be made deliberately, rather than as a scoreboard. Reports that get used as scoreboards produce careful timers, not accurate ones.
Concise report Link copied!
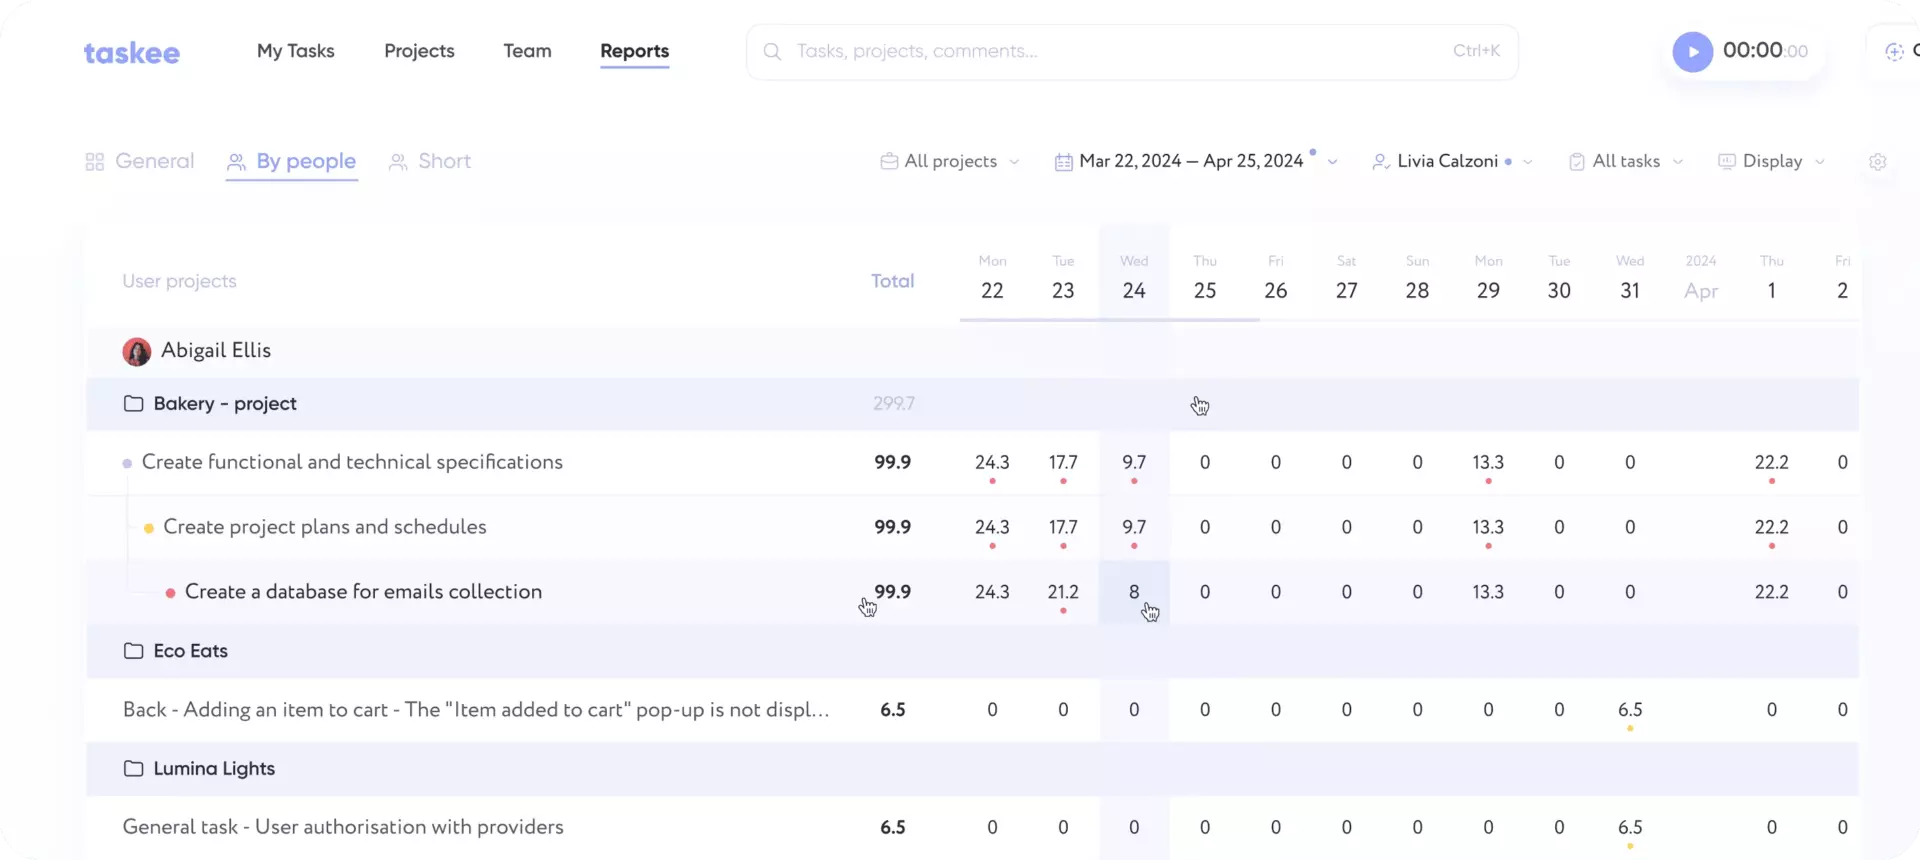
Concise report offers overall time of work of every employee, summing up all employee’s projects on each day without additional details.
The concise report exists for the cases where the breakdown is not the point. Preparing an invoice, filling in a payroll figure, checking whether recorded days look plausible before a month is closed — all of these want one number per person per day and nothing else.
It is also the quickest way to spot a tracking problem rather than a work problem. A day with fourteen hours on it usually means a timer was left running, and a day with nothing on it usually means one was never started. Both are visible instantly in a concise view and easy to miss in a detailed one, which is why it is worth glancing at before anyone builds a conclusion on the detailed reports.
The same one-number-per-person view is what an invoice or a payroll line needs in a spreadsheet, and it does not have to be retyped: Export these reports to CSV.
Who reads which report Link copied!
Client service teams live in the general report filtered to one project: it is the evidence behind an invoice and the material for a scope conversation when a project is running longer than agreed. See agencies, consulting and creative agencies.
Team leads and managers use the report on people for allocation and for spotting the quiet overload that nobody raises. See management teams and operations.
Finance and administration use the concise report, because a per-day total per person is the input their processes actually take. See finance teams and accountants.
Delivery teams use finished-work filters as an estimation input: what similar work actually took last time beats a fresh guess. See IT teams and product development.
Distributed teams rely on reports because there is no room to read effort off. See remote teams.
Reports, time tracking and project activity Link copied!
Three things that all look like “what happened”, answering different questions.
Time tracking is capture — the timer on the task and the manual entries that fill its gaps. Reports are worth exactly as much as the tracking beneath them: a team that tracks sporadically gets reports that are precise and wrong.
Reports — this page — are aggregation. They answer how much, by whom, on what, over what period.
The Recent Activity tab on a project is a different thing again: a chronological record of actions taken, which answers what changed rather than how long it took. That lives under project management.
And when the question is where work currently stands rather than what it consumed, that is the Kanban board — position, not effort.
See where your team’s hours actually go — create a company in Taskee. Reports are included, not a reporting upgrade — see pricing.


